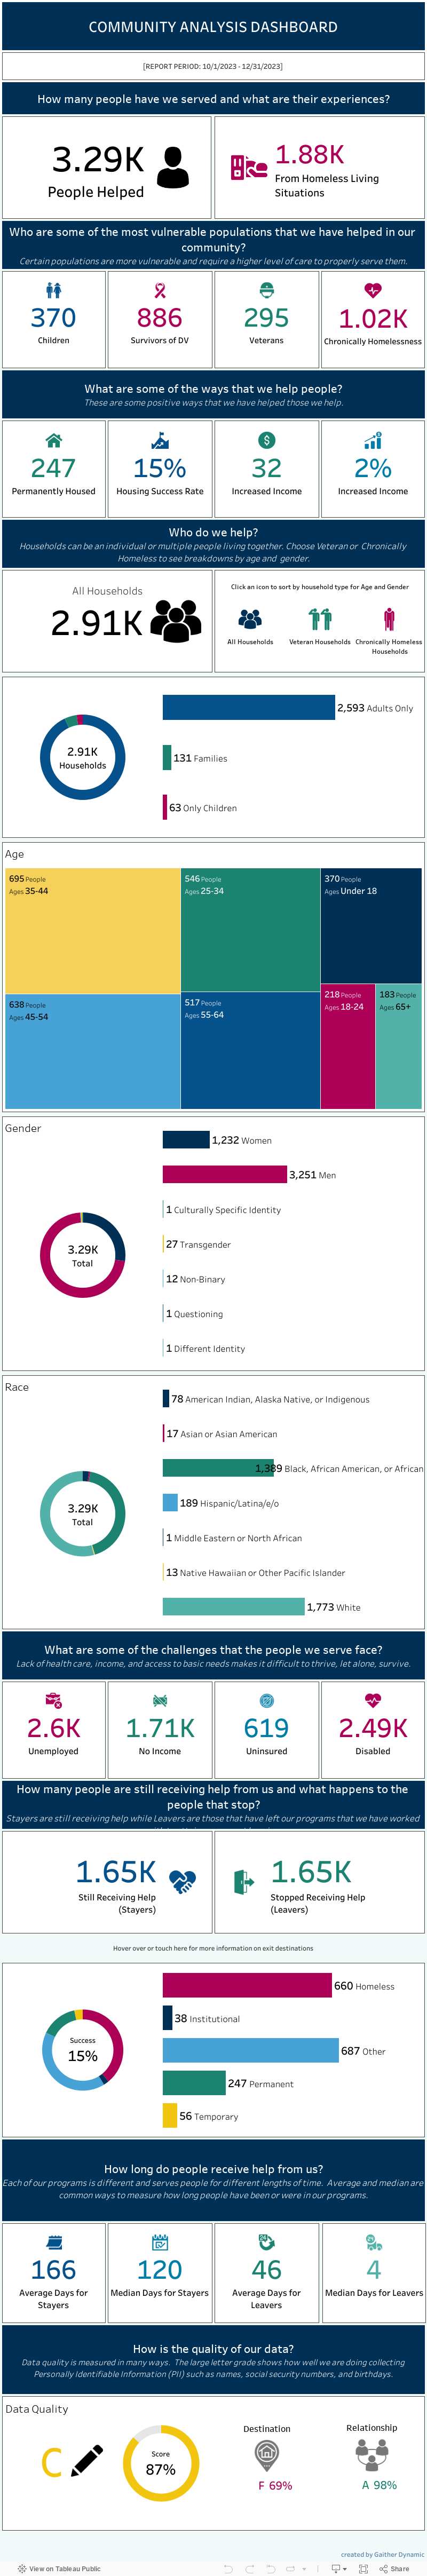
The Analysis Dashboard is based on the Louisville CoC’s Annual Performance Report and includes 3 different project types only:
1) Emergency Shelter Projects
2) Transitional Housing Projects (very similar to, but slightly more stable than, emergency shelter)
3) Street Outreach Projects
The dashboard will be generated quarterly and the data will compound throughout the year based on new data from each new quarter. The date range chosen follows the federal fiscal year (October 1 – September 30). We will reset the data with each new fiscal year.
The three project types listed above serve homeless individuals exclusively and can be used, thoughtfully, to pinpoint to the best of our ability current numbers regarding homelessness in the Louisville area at any given time.
It is VERY important to understand that discussing the notion of “unsheltered” clients and numbers pertaining to that population is very difficult. Our system captures clients who choose to utilize CoC services. Street outreach is our best tool for discussing unsheltered clients, but it absolutely cannot be the final word with regards to numbers for that population. Lastly, when viewing the data below, use caution with your assumptions. Our dashboards are a goodwill presentation meant to provide data about our system to our community in an easily read format. Know that our Analysis dashboard is not an official documentation of our data.
Date Range:
Fiscal Year 1st and 2nd Quarter
October 1, 2024 thru March 30, 2025